a) Convince yourself that the brightness pattern of light on the screen is a cosine function. (HINT: Think about the conditions for constructive and destructive interference of the light waves emerging from each slit).
b) Now imagine a second set of slits placed just inward of the first set. How does the second set of slits modify the brightness pattern on the screen?
c) Imagine a continuous set of slit pairs with ever decreasing separation. What is the resulting brightness pattern?
d) Notice that this continuous set of slits forms a “top hat” transmission function. What is the Fourier transform of a top hat, and how does this compare to your sum from the previous step?
e) For the top hat function’s FT, what is the relationship between the distance between the first nulls and the width of the top hat (HINT: it involves the wavelength of light and the width of the aperture)? Express your result as a proportionality in terms of only the wavelength of light λ and the diameter of the top hat D.
f) Take a step back and think about what I’m trying to teach you with this activity, and how it relates to a telescope primary mirror.
Simple, right? Let's take this one step at a time.
What we know:

Part A: Convince yourself that the brightness pattern of light on the screen is a cosine function. (HINT: Think about the conditions for constructive and destructive interference of the light waves emerging from each slit).
First we must think about the nature of waves. When two waves interact with each other they overlap, creating constructive interference (where both waves add to each other) and destructive interference (where the two waves cancel each other out) as shown below.


Where if n is a whole integer there is constructive interference as the wavelengths add together and destructive interference in between where half-wavelengths for r cancel each other out.
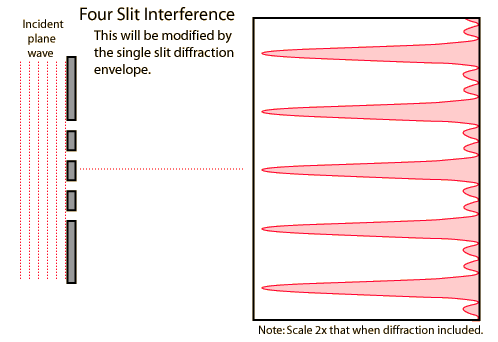
Part B: Now imagine a second set of slits placed just inward of the first set. How does the second set of slits modify the brightness pattern on the screen?
So we set up the experiment as shown below, but how do we get to the shown pattern?

Well, we know the first set of slits gives a cosine pattern. The second, inner set of slits would also give a cosine pattern, yet with a larger period. This is supported by the given equation \[ y \propto
n \cdot L \cdot \frac{\lambda}{D}\] where y is the distance between maxima, so with a smaller distance between slits, the distance between maxima is greater.
Now all we have to do is add the two cosine functions:

and we get a new brightness pattern for four slits as shown above, with more intense spots of constructive interference.
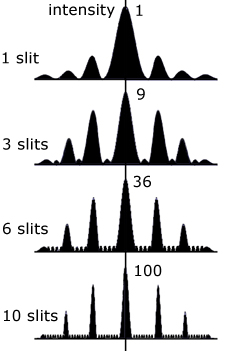
Part C: Imagine a continuous set of slit pairs with ever decreasing separation. What is the resulting brightness pattern?
This means adding more and more cosine functions

until you get:

Eventually, adding all these slit pairs will give one, large slit with increasing intensity in the center that looks something like the image below:

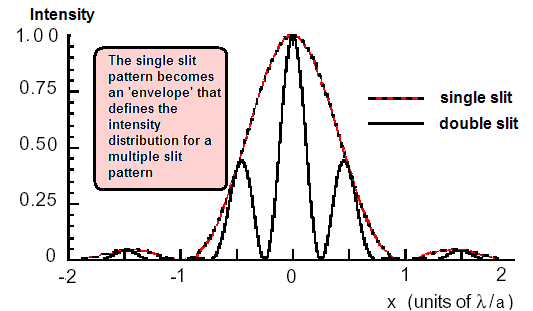
Part D: Notice that this continuous set of slits forms a “top hat” transmission function. What is the Fourier transform of a top hat, and how does this compare to your sum from the previous step?
The Fourier transform gives us a Sinc pattern of brightness, which looks like our sum from the previous step.

Part E: For the top hat function’s FT, what is the relationship between the distance between the first nulls and the width of the top hat (HINT: it involves the wavelength of light and the width of the aperture)? Express your result as a proportionality in terms of only the wavelength of light λ and the diameter of the top hat D.
To understand this question, we have to know what W represents in the image above. W is a dimensionless quantity that describes how many wavelengths wide a gap, D, is. We can define this as: \[W = \frac{D}{\lambda} \]
To find the distance between two nulls, we can use the image above and see that it would be twice of \(\frac{1}{W}\) giving us: \[distance = \frac{2}{W} \: or \: distance = \frac{2\lambda}{D}\]
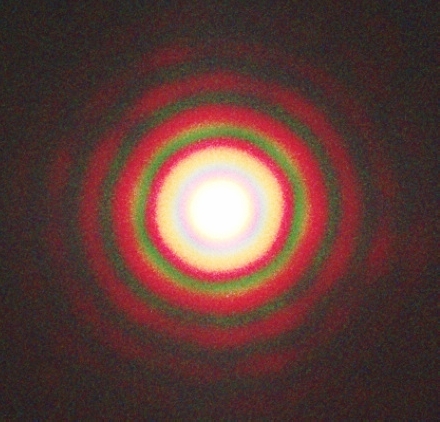
Part F: Take a step back and think about what I’m trying to teach you with this activity, and how it relates to a telescope primary mirror.
We can think of the mirror on a telescope as a single slit diffraction experiment:

In reality, the light would bounce back from the mirror, but it is easier to represent it "passing through" like a single slit. The "slit" (really the mirror) blocks out all light on the sides, takes in some light and allows it to spread, amplify, and gain intensity. Essentially, we can then see something as "bigger" than with our naked eye. Due to the previously discussed interference patterns, powerful telescope would show a star not as a point of light, but as an interference pattern like below:

Acknowledgements: Thanks to Barra and Eden for struggling through this worksheet with me and to Andrew for helping us at TALC.
No comments:
Post a Comment